Summary
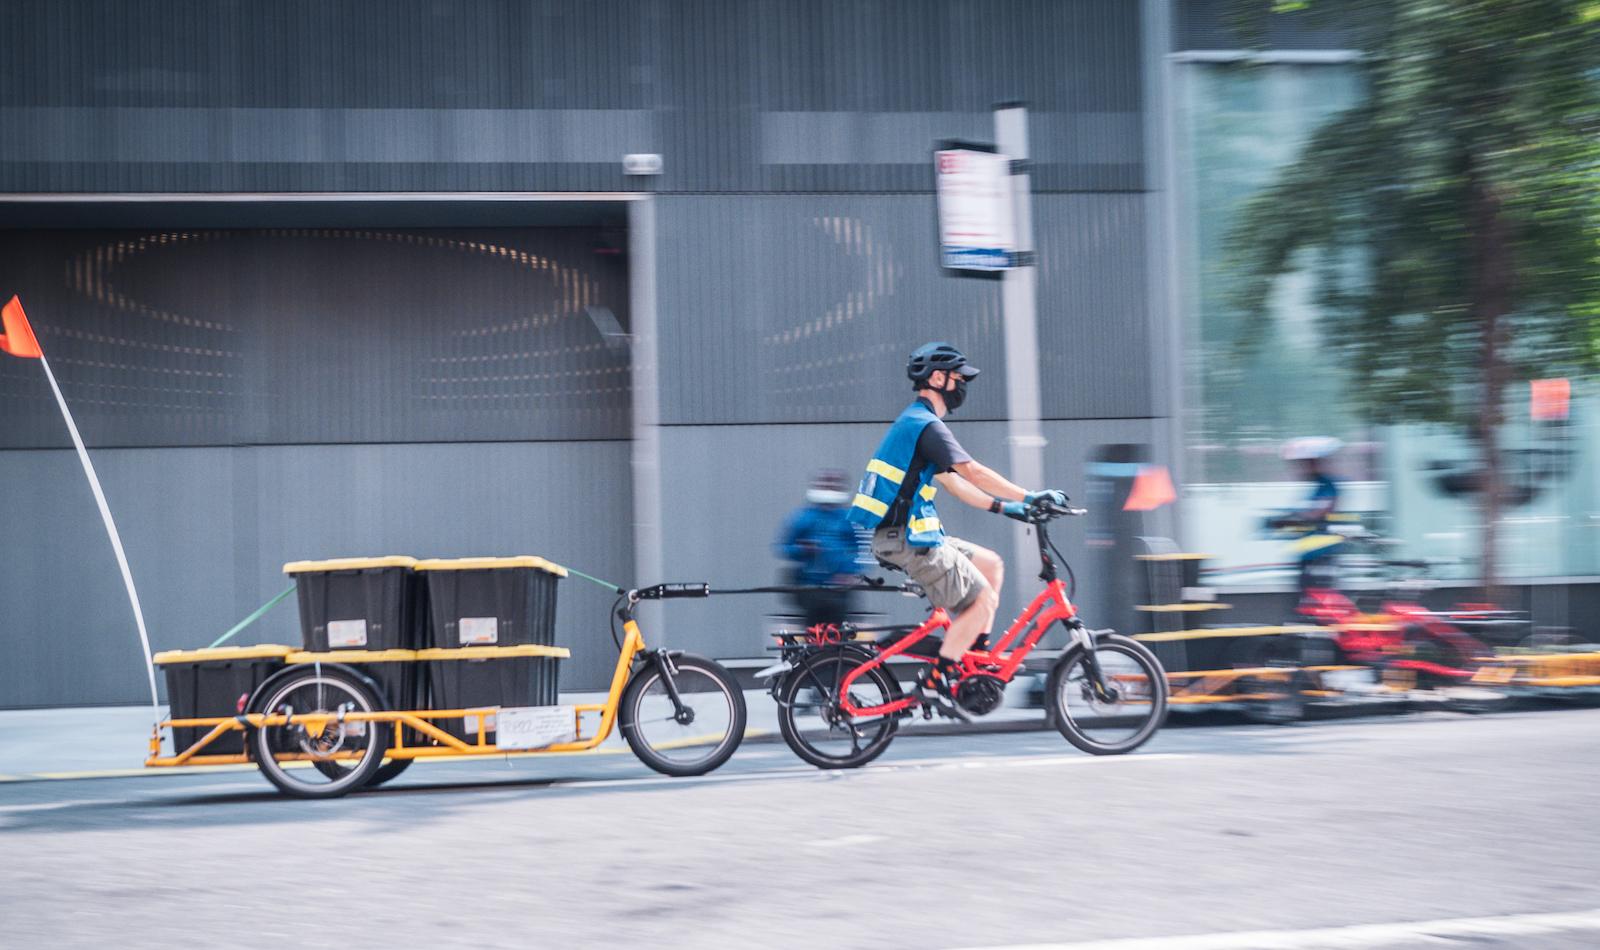
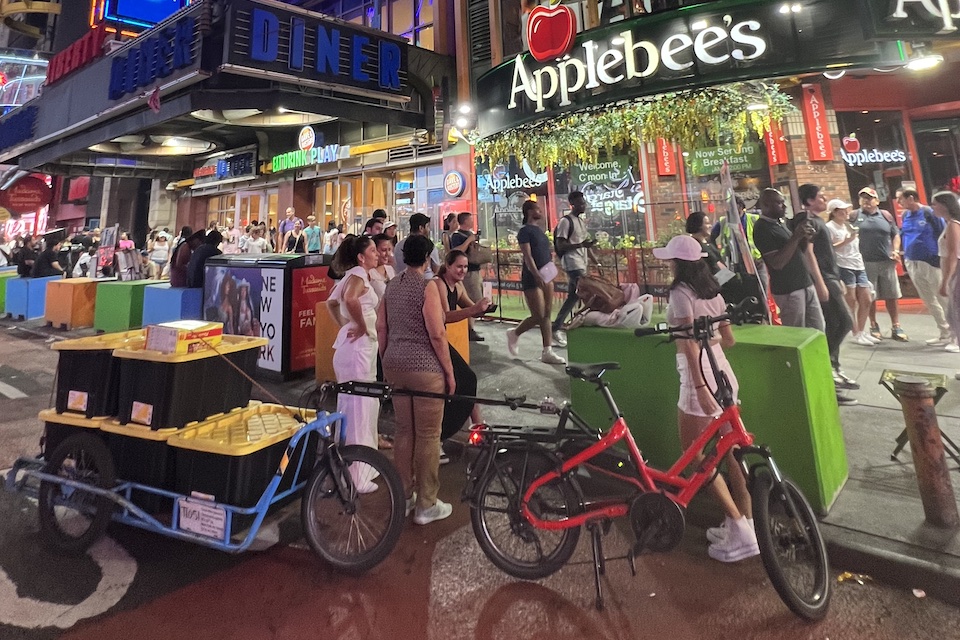
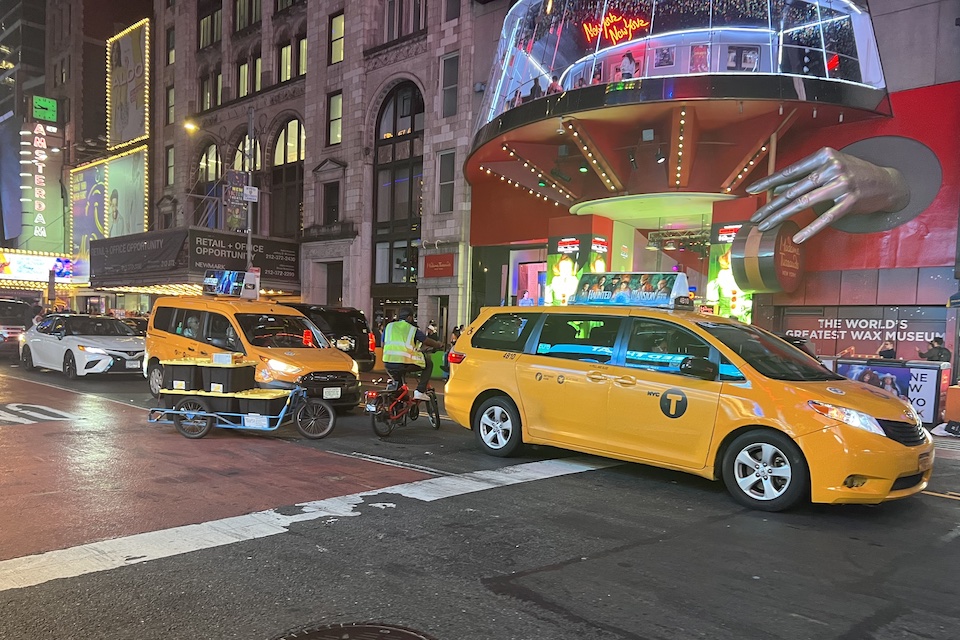
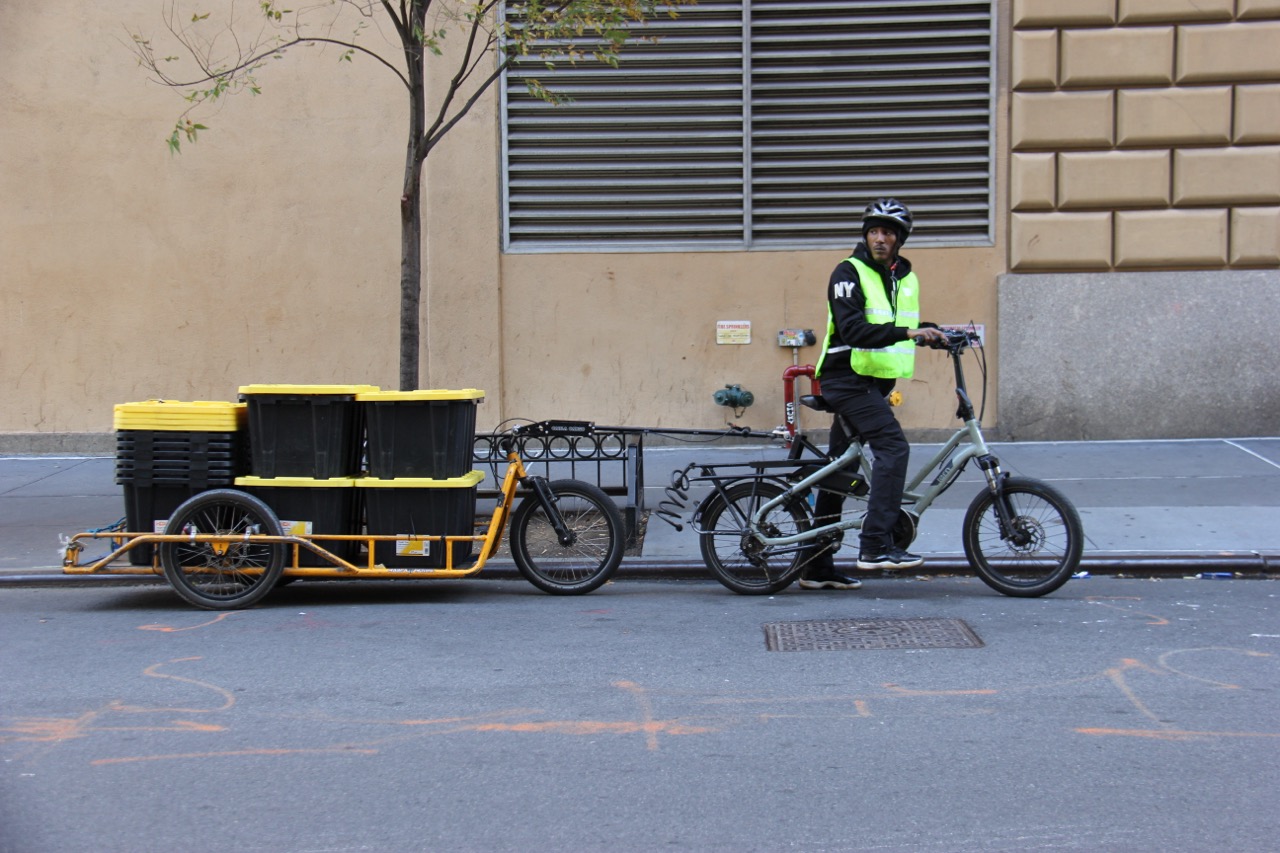
A familiar sight in many of New York’s busiest neighborhoods, sturdy Tern e-cargo bikes paired with heavy-duty trailers have become a notable part of the city’s delivery landscape.
First deployed on Manhattan streets in 2021, these rigs are now used by multiple logistics partners and collectively complete more than 13 million deliveries each year. They operate in near-constant rotation, with some bikes reaching twenty hours during peak demand.
Rigs haul loads of up to 300 pounds or more. One Tern partner reports daily totals often reaching 360 deliveries per rig, an average of 22.5 deliveries per hour.
No academic study has examined the efficiency of these specific rigs, so this case study instead draws from operator feedback, other delivery research, and publicly available data. The findings point in the same direction, showing that Tern e-cargo-bike rigs deliver efficiency that rivals van performance on dense urban routes. In terms of operational costs, the same annual budget required to keep one van on the road can keep six to seven cargo-bike rigs in continuous service.
These findings, combined with the reduced curbside friction and meaningful environmental gains, make the case for cargo-bike rigs compelling for any fleet manager seeking a resilient, efficient, and city-friendly last-mile solution.
Scope of deployment
Tern cargo-bike rigs operate through localized delivery hubs and microhubs in NYC. Larger delivery trucks travel to the hubs and unload cargo to the cargo rigs for final delivery. Packages are typically sorted into bins, loaded onto trailers, and dispatched on repeated runs throughout the day. Riders work in two-hour runs, with rigs handed off between shifts so they can remain in continuous use, for up to twenty hours/day during peak periods.
Rigs often complete eight runs in a day, each with nine bins and roughly five deliveries per bin, totaling about 360 deliveries per day, or about 22.5 deliveries per hour. Tern rigs collectively now complete more than 13 million deliveries across New York City per year.

Delivery efficiency
Public route-level data for New York City is limited, but hiring expectations and driver interviews consistently show that vans typically complete 200–250 deliveries during a ten-hour shift.
Using Tern’s benchmark of 22.5 deliveries per hour, a cargo-bike rig would complete roughly 225 deliveries over the same period, placing rig throughput squarely within the performance range expected of urban last-mile vans.
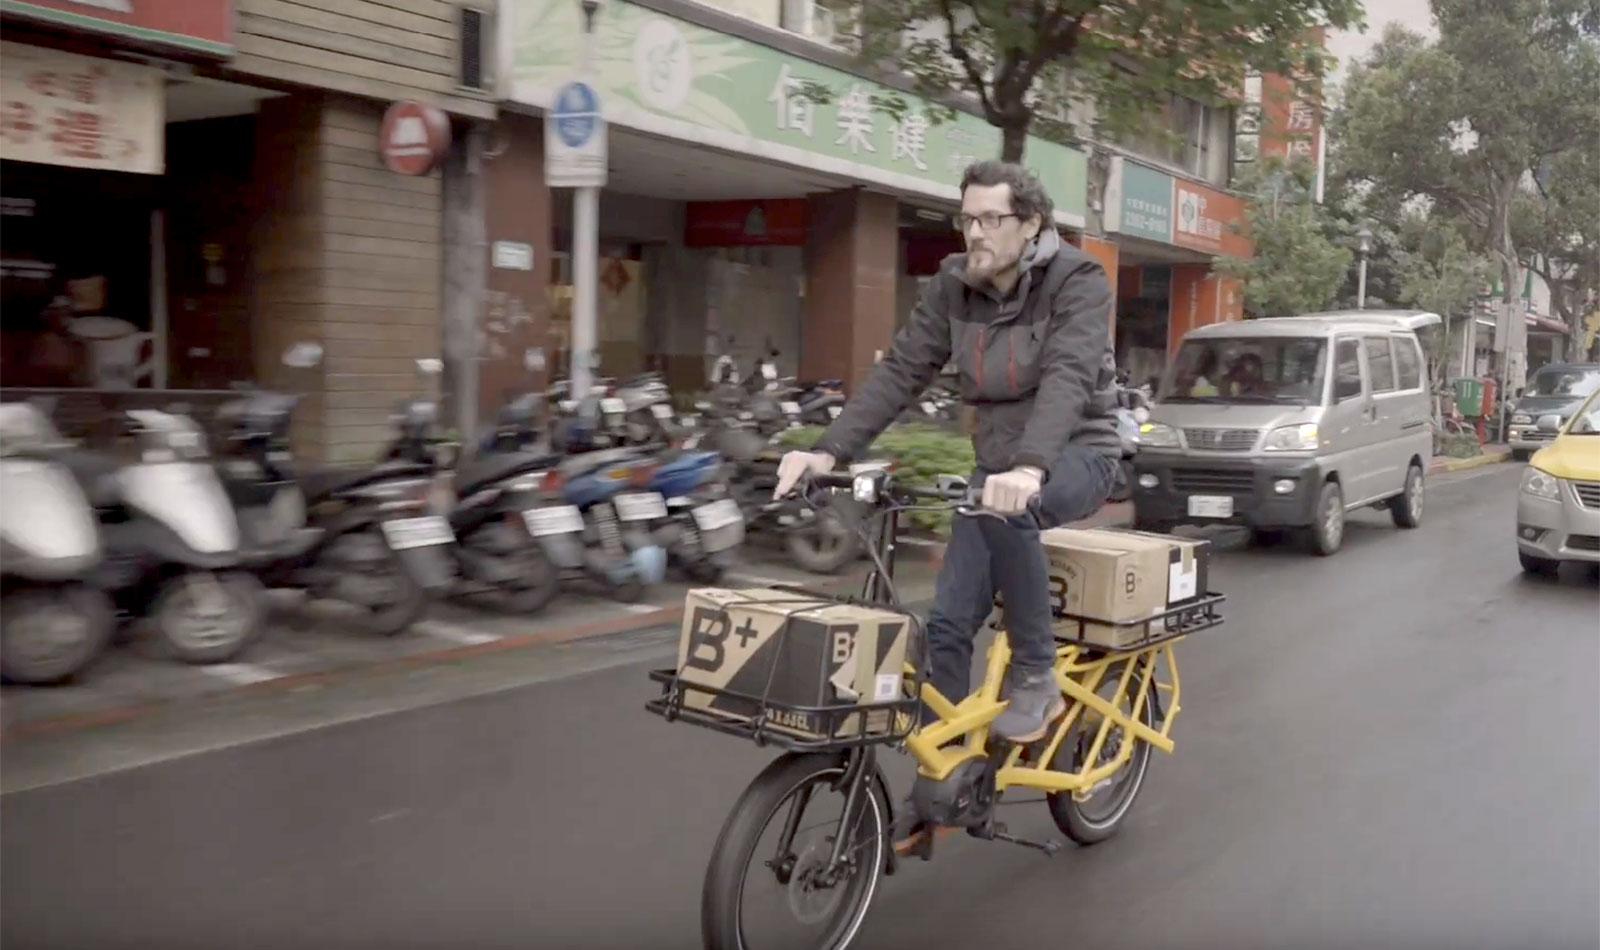
While cargo-bike capacity may seem limited at first glance, compact size becomes a major operational advantage on dense routes. Riders can maintain steadier speeds, follow predictable bike-lane corridors, and avoid many of the traffic delays that routinely slow vans.
A critical difference then emerges at the curb. In New York, curb access is scarce, loading zones are limited, and many locations are already filled with parked cars. As a result, vans routinely circle the block looking for space, settle for parking well away from the destination, or risk a ticket. These final fifty feet of delivery play a major role in delivery efficiency. Research from the University of Washington Urban Freight Lab found that commercial delivery vehicles in dense city centers spent about 28 percent of total trip time searching for parking [1].
The problem is compounded once the vehicle is finally parked. Vans often stop farther from the delivery point, which increases walking distances, handling times, and exposure to traffic. Urban Freight Lab data shows that vans spend up to eighty percent of total operating time parked, with a median dwell time of 17.6 minutes on dense routes. Cargo bikes, by comparison, spend about sixty percent of operating time parked, with median dwell times of 4.3 minutes [2]. A NYC DOT evaluation reported similar findings, with cargo-bike dwell times of five minutes or less [3].
Taken together, these findings reinforce the NYC DOT conclusion that cargo bikes can replace vans at roughly a two-to-one ratio across most dense routes and, in some high-density areas, achieve a one-to-one replacement ratio [4].
Operation costs comparison
Once delivery throughput is comparable, cost becomes the decisive variable. This section examines the major cost drivers, including capital, energy, maintenance, insurance, and curbside penalties, using a consistent mileage baseline. The numbers all point in the same direction: cargo-bike rigs deliver the same functional output as vans, with annual savings up to 80 percent lower than van operations.
At fleet scale, that gap widens quickly. A major European operator, which handles roughly two billion parcels per year, reported that shifting to a mixed network built around cargo bikes, with e-vans in support, resulted in hundreds of millions of euros in annual savings compared to a pure e-van fleet [5].
The following subsections detail how each cost input was calculated.
Mileage
Accurate cost comparison starts with realistic mileage. In dense U.S. cities, delivery vans typically log around 70 miles per day [6], but New York operates differently. Mileage is not usually accrued during delivery, but in the commute. Dense delivery zones create short route loops, but almost all Manhattan-serving vans begin and end their shifts in depots and parking facilities miles outside Manhattan, in areas including Brooklyn, The Bronx, Long Island, or New Jersey [7].
To provide a conservative and fleet-relevant baseline, this analysis assumes a per-day average of 40 miles for delivery vans. This reflects both short route loops and the unavoidable depot-to-Manhattan commute.
Vehicle capital
Class 2a–3 delivery vans are the workhorses of New York’s last-mile system: large enough to consolidate a few hundred parcels, small enough to navigate narrow one-way residential streets.
A new Class 2–3 electric delivery van suitable for this work typically ranges from $45,000 to $80,000, depending on configuration and battery size [8]. A comparable diesel model typically falls between $35,000 and $55,000 [9]. Leasing can smooth near-term cash flow, but depreciation and asset risk begin the moment the vehicle enters service.
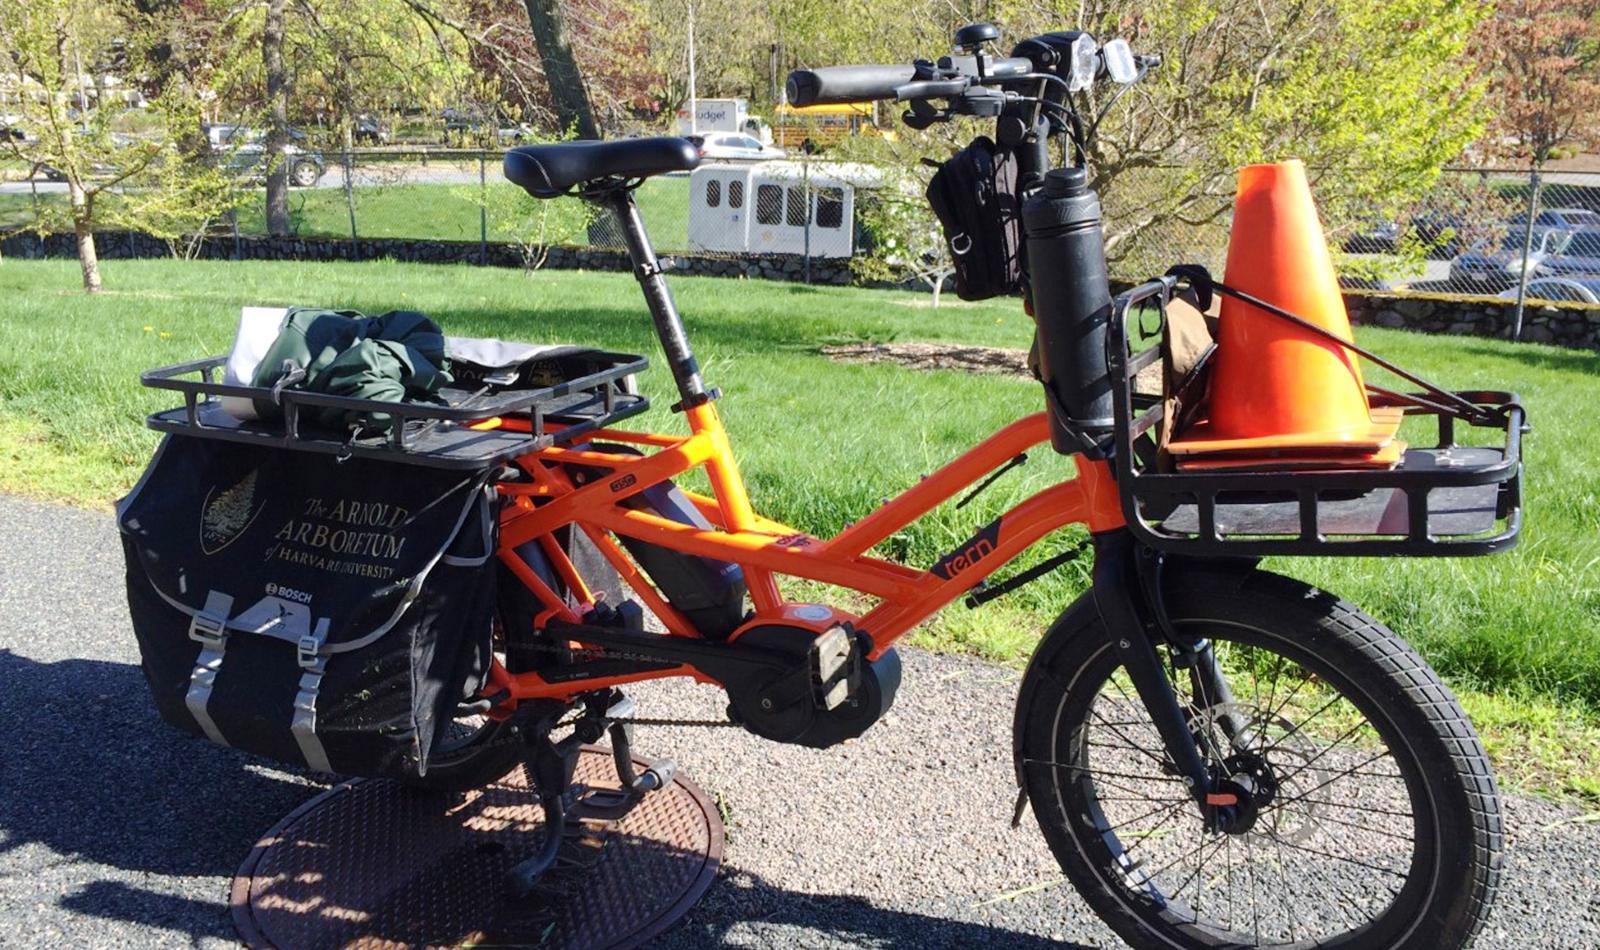
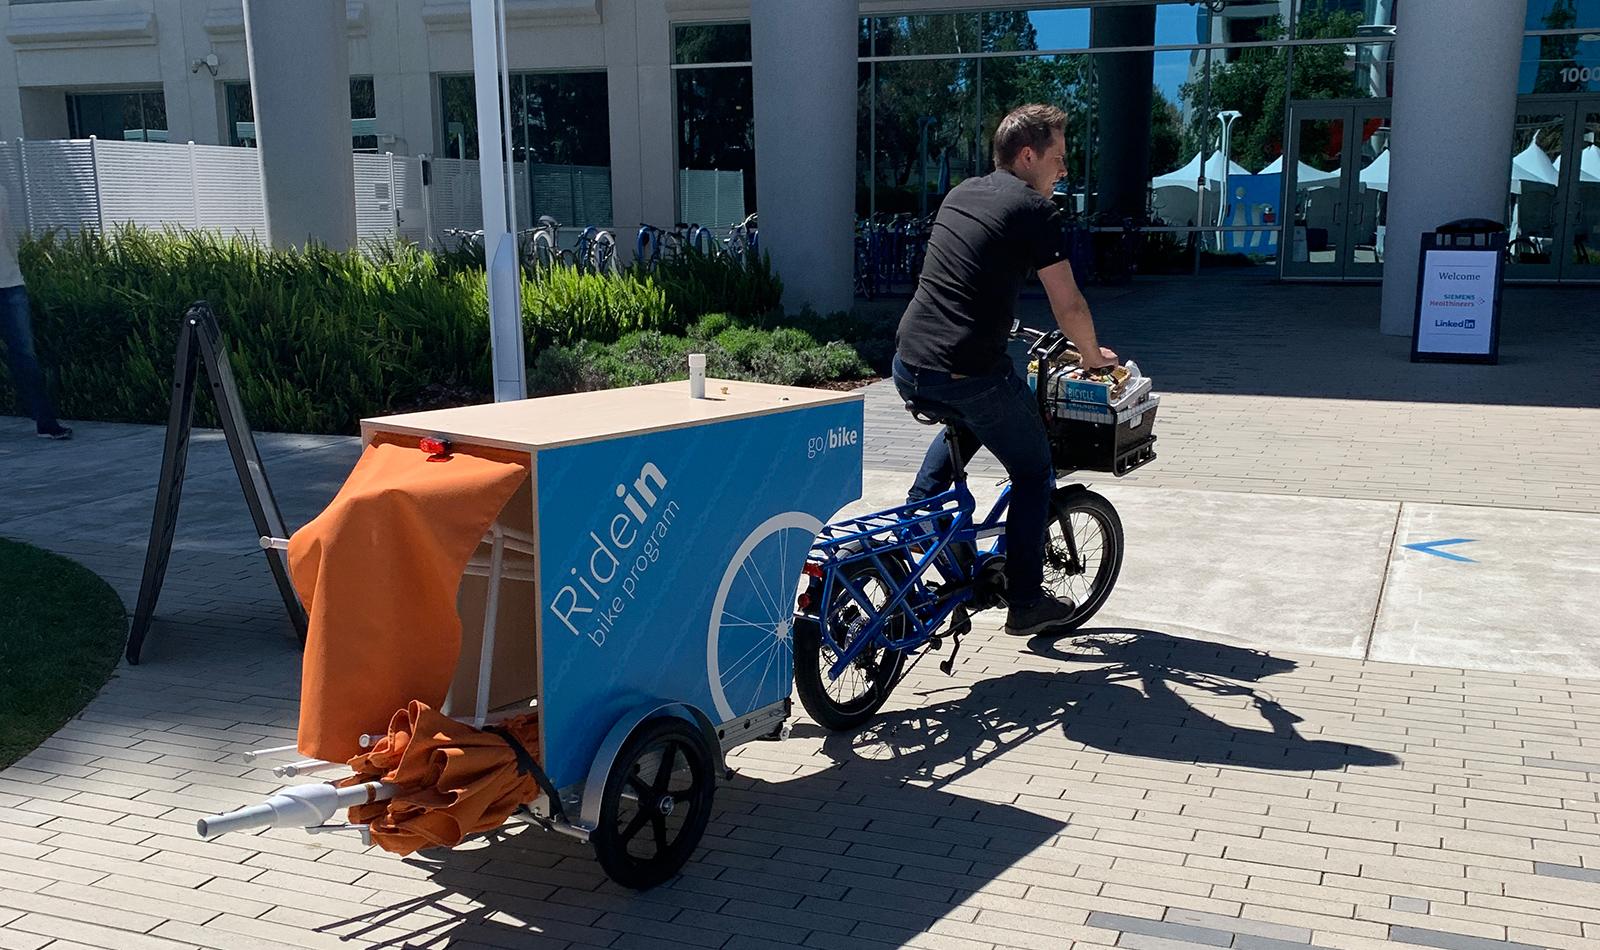
By comparison, a complete cargo-bike rig, a Tern e-cargo bike paired with a heavy-duty trailer, can be deployed for well under $10,000. In capital terms, a fleet manager can place five to eight cargo-bike rigs into service for the cost of one new electric van.
For modeling, capital costs are amortized over six years, following standard fleet TCO conventions [10], using midpoint pricing for vans and a conservative high-end estimate for rigs:
- $62,500 for a new electric van
- $45,000 for a new diesel van
- $10,000 for a complete cargo-bike rig
Fuel
Fuel and energy represent the most visible day-to-day operating divergence. A diesel van operating in dense urban conditions typically achieves around 11 mpg, producing a fuel cost of roughly $0.32 per mile at $3.50 per gallon [11]. Over 10,000 annual miles, that equates to ~$3,200 in fuel per year, not including volatility.
Electric vans reduce per-mile energy cost but introduce charging-infrastructure expense. A public-fleet assessment found that when charging hardware, installation, and amortized utility upgrades are included, the true energy cost for electric vans averages $0.11 per mile [12].
Cargo-bike rigs operate on an entirely different scale. Fully charging an e-cargo-bike battery typically costs $0.10–$0.15 [13], often enough for a full delivery shift. Even with mid-route swapping, annual energy costs remain negligible, tens of dollars, not thousands.
Parking violations
Parking violations in New York are not incidental; they are a structural cost of operating vans in a city with limited curb space. Dense neighborhoods offer few legal loading opportunities. Vans must choose between circling the block and losing time, or stopping illegally and accepting the risk of a ticket. UPS alone paid an estimated $23 million in parking fines in 2019 [14].
Looking at multiple fleets, industry estimates, and NYC ticket data indicate that large carriers typically incur 75–100 citations per vehicle per year, averaging ~$50 per ticket. This analysis uses a conservative benchmark of 80 tickets annually, or ~$4,000 per van [15].
Cargo-bike rigs eliminate this line item. They fit into small curb gaps, stage briefly without blocking traffic, and have near-zero reported parking violations.
Maintenance
Maintenance is one of the most consistent cost separators between vans and cargo-bike rigs. A major U.S. fleet study reports that diesel Class 2b–3 vans average $0.128 per mile in maintenance, while electric vans reduce that burden by roughly 40 percent due to fewer drivetrain and brake-system components [16]. At 10,000 annual miles, this equates to:
- Diesel van: ~$1,280 per year
- Electric van: ~$768 per year
Cargo-bike rigs rely on simpler mechanics and inexpensive wear parts. A comparative study of real-world operations found cargo-bike maintenance costs to be roughly 60 percent lower than diesel vans [17], yielding:
- Cargo-bike rig: ~$512 per year
For fleet managers, the implication is straightforward: vans carry vehicle-scale maintenance requirements that scale with mileage. Cargo-bike rigs are serviced with standard bicycle tools and readily available parts, keeping downtime low and predictable.
Insurance
Insurance represents one of New York’s highest recurring operating costs for van fleets, and unlike fuel or maintenance, it reflects exposure rather than operational decisions.
Commercial auto brokers cite premiums of $3,500–$7,000 per year for mid-size delivery vans operating in New York City [18]. Dense Manhattan routes typically fall at the upper end of that range. For modeling, a conservative figure of $5,000 per van is used.
Cargo bikes fall under a different insurance category. Their lower mass, reduced collision energy, and predictable curb behavior yield proportionally lower premiums, roughly $1,000 per rig per year.
Cost conclusions
When annual operating costs are tallied, capital amortization, energy, maintenance, insurance, parking violations, and registration/inspection fees, the pattern is consistent. Electric and diesel vans in New York accumulate more than $21,000 in annual operating expenses per vehicle.
In contrast, a cargo-bike rig lands at roughly $3,200 per year.
The gap is not a rounding error; it is structural. It persists across powertrains, delivery zones, and operating conditions because cargo-bike rigs fit the city. They don’t incur parking violations, they don’t require state registration or inspection, they cost pennies to power, and maintenance demands are minimal.
For fleet managers, the effect compounds quickly. The same budget required to keep one van in service can keep six or more cargo-bike rigs operating continuously. As congestion charges, emissions rules, and neighborhood scrutiny increase, the financial advantage grows even stronger.
| Cost Category | Electric Van | Diesel Van | Cargo-Bike Rig |
| Annual Mileage | 10,000 miles/year | 10,000 miles/year | 10,000 miles/year |
| Capital Cost (Annualized) | $10,417 | $7,500 | $1,667 |
| Fuel / Energy Cost | $1,100 | $3,200 | $38 |
| Maintenance | $768 | $1,280 | $512 |
| Parking Violations | $4,000 | $4,000 | $0 |
| Insurance | $5,000 | $5,000 | $1,000 |
| Registration & Inspection | $200 | $200 | $0 |
| Total Annual Cost | $21,485 | $21,180 | $3,217 |
And the advantages extend well beyond cost. The next sections detail the environmental gains and street-level improvements that cargo-bike rigs deliver in dense urban operations.
Reduced congestion using cargo bikes
New York’s last-mile demand has grown steadily in recent years, driven largely by residential deliveries. Roughly 80 percent of New York households now receive at least one delivery per week [19], creating sustained delivery volumes on streets that were never designed for commercial unloading. Many residential blocks in Manhattan are narrow, one-way corridors with no loading zones, where a single double-parked van can disrupt traffic flow for the entire block.
The congestion effect is measurable. A study using Manhattan traffic data found that every additional 100 vehicle stops can reduce nearby travel speeds by up to 3.7 mph on weekdays and 4.5 mph on weekends [20]. On dense residential grids, this impact compounds quickly as multiple vans make repeated stops along the same corridor.
Cargo bikes avoid most of the curb-related behaviors that create those slowdowns. They can slip into small curb gaps, use bike lanes for predictable routing, or stage briefly from the sidewalk without blocking lanes or forcing drivers to maneuver around them. This matches how they are used in practice. Approximately 80 percent of New York’s cargo-bike deliveries are to residential addresses [21], which are the exact areas where vans generate the most congestion.
Environmental and social benefits
For fleet operators, replacing twenty daily van miles with twenty cargo-bike miles avoids roughly seven tons of CO₂ per bike per year [22]. Applied across New York fleets using Tern rigs, that amounts to more than 1,500 tons of CO₂ avoided annually, which is roughly equivalent to nearly four million fewer car miles driven in the city [23].
The local air-quality benefits are just as immediate. Diesel remains a major component of New York’s last-mile system, and a significant share of deliveries are still handled by older, heavy-duty diesel vehicles. City data shows that diesel trucks make up less than 10 percent of vehicles on the road yet generate as much as 80 percent of tailpipe PM₂.₅ emissions [24].
The health burden tied to that exposure is well documented. The New York City Department of Health reports that long-term exposure to fine particulate matter contributes to roughly 2,000 deaths each year [25]. Communities located near busy delivery corridors and warehouse clusters often face the highest pollution loads, and many of these neighborhoods are low-income or historically disadvantaged [26].

The right cargo bikes for high-volume delivery
Minimizing downtime is essential for fleets completing tens of thousands of deliveries per day. Tern cargo rigs have logged more than one million fleet miles in New York, and every bike that remains in rotation instead of sitting in a repair queue delivers a direct operational advantage compared with van-based systems.
High-throughput delivery places extraordinary demands on equipment. New York has become a proving ground for Tern’s design principles, showing how purposeful engineering, rigorous validation, and strong component partnerships translate into reliability at scale. Components are selected for both performance and serviceability, allowing fleets to replace wear parts quickly with standard tools and readily available spare parts. This keeps rigs circulating through multi-shift operations with minimal downtime.
Some bikes have logged more than 30,000 miles. Wear parts are replaced as expected, but frames have remained structurally sound, reflecting Tern’s focus on third-party validation. Current-generation frames are independently tested to the only national cargo bike standard, Germany’s rigorous DIN 79010 standard, which evaluates fatigue, maximum load, and overload performance for cargo bikes.
The Bosch systems that power Tern cargo bikes have also proven exceptionally dependable through years of continuous operation. Most batteries continue to deliver consistent performance well past their warranted life and even after tens of thousands of miles. Motor failures are rare, but if they do happen, Bosch’s service support is fast and efficient.
Electrical safety at scale
Running an urban cargo-bike fleet also means charging large numbers of batteries every day. Operators across the city learned quickly that this concentration of stored energy requires strict electrical safety protocols.
Tern addressed this well before local rules required it. All Tern cargo bikes use Bosch motors and batteries certified to UL 2849, the industry’s most comprehensive e-bike electrical safety standard. After years of continuous deployment and hundreds of thousands of charge cycles combined, Bosch-powered Tern bikes have recorded zero thermal incidents.
Operational takeaway
The experience of Tern cargo rigs in New York demonstrates that high-duty cargo-bike fleets can match the productivity of delivery vans while operating at significantly lower cost and with fewer operational constraints. For fleet managers focused on uptime, predictable performance, and scalable deployment, cargo-bike rigs offer a proven, field-tested alternative that is ready to expand across more routes and more cities.
Want to learn more about how cargo-bike rigs could work for your operations? Contact us.
Endnotes
[1] – Parking-Search Time
Amaya, J., Encarnación, T., & Delgado-Lindeman, M. (2023). Understanding delivery drivers’ parking preferences in urban freight operations. Transportation Research Part A: Policy and Practice, 176.
The study models curb-access and parking-search delays in dense urban environments and finds that searching for a parking spot represents a significant share of total delivery time.
[2] – UFL Dwell-Time Comparison
University of Washington Urban Freight Lab. (2023). Biking the Goods: Evaluating Electric Cargo Bike Delivery Performance and Efficiency in Urban Environments.
Finding:
Vans spend up to 80 percent of operating time parked, with a median dwell time of 17.6 minutes. Cargo bikes spend ~60 percent of operating time parked, with median dwell times of 4.3 minutes.
[3] – NYC DOT Dwell-Time Confirmation
New York City Department of Transportation. (2021). Commercial Cargo Bicycle Pilot: Evaluation Report.
Finding: Cargo-bike dwell times of five minutes or less on dense New York City routes.
[4] – NYC DOT Van-Replacement Ratio
New York City Department of Transportation. (2021). Commercial Cargo Bicycle Pilot: Evaluation Report.
Finding: Cargo bikes can replace vans at approximately a 2:1 ratio on most routes, and 1:1 on the densest routes.
[5] – Mixed Fleet Savings (EIT InnoEnergy)
EIT InnoEnergy. (2024). Study: Logistics companies could save over half a billion euros annually using mixed electric delivery fleets.
Finding: Mixed cargo-bike + e-van networks can reduce annual costs by hundreds of millions of euros for large operators.
https://www.innoenergy.com/news-resources/study-logistics-companies-could-save-over-half-a-billion-euros-annually-using-mixed-electric-delivery-fleets/
[6] — Urban Delivery Van Mileage (~72 miles/day)
Cokyasar, T., Jabali, O., & Van Woensel, T. (2022).
A Time-Constrained Capacitated Vehicle Routing Problem in Urban E-Commerce Delivery.
Transportation Research Part E / arXiv preprint (arXiv:2201.04036).
The study models last-mile delivery operations across four U.S. cities—including Austin and Detroit—and finds that delivery vans average approximately 72 miles of vehicle-miles traveled (VMT) per day under typical urban e-commerce routing conditions.
Source: https://arxiv.org/abs/2201.04036
[7] – NYC Depot Locations and Delivery Density
New York City Department of Transportation. (2021). Delivering New York: A Smart Truck Management Plan.
Confirms that most parcel-delivery depots serving Manhattan are located in Brooklyn, Queens, Long Island, or New Jersey, requiring cross-borough travel before deliveries begin.
https://www.nyc.gov/html/dot/downloads/pdf/delivering-ny-smart-truck-management-plan.pdf
[8] – Electric Van Pricing
U.S. Department of Energy, Alternative Fuels Data Center.
New Medium-Duty Electric Vehicle Pricing (Class 2–3 Vans and Trucks).
Typical price range: $45,000–$80,000.
https://afdc.energy.gov/vehicles/search
[9] – Diesel Van Pricing
Edmunds Commercial Vehicle Pricing Guide (2024).
MSRP Ranges for Class 2a–3 Internal-Combustion Cargo Vans.
Typical price range: $35,000–$55,000.
https://www.edmunds.com/
[10] – Fleet Amortization Standard
International Council on Clean Transportation (ICCT). (2022).
Total Cost of Ownership for Commercial Vans and Urban Delivery Vehicles.
Fleet TCO models typically use 5–7 year amortization periods.
https://www.theicct.org/wp-content/uploads/2022/01/cost-ev-vans-pickups-us-2040-jan22.pdf
[11] – Diesel MPG Benchmark
U.S. Department of Energy, Office of Energy Efficiency & Renewable Energy.
Fuel Economy for Delivery Vans and Light Trucks.
Typical in-service fuel economy for Class 2–3 vans in urban duty cycles: 10–12 mpg.
https://www.fueleconomy.gov/feg/commercial/index.shtml
[12] – True Cost of Charging Electric Vans
Washington State Department of Commerce. (2023).
Public Fleet Electrification Analysis: Total Cost of Ownership Findings.
BEVs in fleet service incur an average all-in charging + infrastructure cost of ~$0.11 per mile.
https://www.commerce.wa.gov/wp-content/uploads/2023/01/EV-Fleet-Electrification-Analysis.pdf
[13] – Cargo-Bike Battery Charging Cost
Con Edison (New York).
Residential & commercial electricity pricing: $0.22–$0.29/kWh.
A full charge of a 500–700 Wh battery costs ~$0.10–$0.20.
https://www.coned.com/en/accounts-billing/your-bill/rates
[14] – UPS Parking Fines
Harper, J. (2020). “UPS, FedEx rack up parking violations…” Gothamist.
Also confirmed by FreightWaves (2020): UPS paid ~$23M in NYC parking fines in 2019.
https://gothamist.com/news/ups-fedex-rack-parking-violations-city-struggles-reduce-congestion
https://www.freightwaves.com/news/ups-hit-with-22m-in-nyc-parking-fines
[15] – NYC Ticket Volume per Vehicle
Estimates of 75–100 parking violations per vehicle per year were derived by triangulating data from multiple sources. Methodology draws on reporting about UPS fleet operations in New York City, including analysis of delivery-truck deployment and curbside activity in Manhattan
New York City Independent Budget Office (IBO). “Stipulated Fine Program: Summary Statistics.”
https://ibo.nyc.ny.us/Revenue/spf-cover.html
(Supply Chain Digital, “UPS to Convert UPS Diesel Delivery Trucks in NYC to Electric,” 2021):
https://supplychaindigital.com/technology/ups-convert-ups-diesel-delivery-trucks-nyc-electric
[16] – Van Maintenance Costs
International Council on Clean Transportation (ICCT). (2022).
Total Cost of Ownership for Commercial Vans and Urban Delivery Vehicles in the United States.
Diesel Class 2b–3 vans: $0.128/mile.
Electric vans: ~40 percent lower maintenance due to drivetrain/brake reductions.
https://www.theicct.org/wp-content/uploads/2022/01/cost-ev-vans-pickups-us-2040-jan22.pdf
[17] – Cargo-Bike Maintenance Savings
Colonna, L., Marcucci, E., Gatta, V., & Comi, A. (2025).
Cargo Bikes and Van Deliveries in Rome: A Comparative Analysis. Future Transportation, 5(4), 145.
Cargo-bike maintenance ≈ 60 percent lower than diesel vans.
https://www.mdpi.com/2673-7590/5/4/145
[18] – Commercial Auto Insurance for NYC Delivery Vans
RefineRisk. (2024).
Commercial Auto Insurance Costs for NYC Delivery Fleets.
Brokers cite $3,500–$7,000 per van annually; dense Manhattan routes trend higher.
https://www.refinerisk.com/commercial-auto-insurance-cost-nyc-delivery/
[19] – Household Delivery Frequency in New York
Mayor’s Office of the City of New York. (2024).
Mayor Adams and DOT Commissioner Rodriguez launch LockerNYC to combat package theft and reduce truck traffic.
Finding: Roughly 80 percent of New York households receive at least one delivery per week.
https://www.nyc.gov/mayors-office/news/2024/04/mayor-adams-dot-commissioner-rodriguez-launch-lockernyc-combat-package-theft-reduce
[20] – Impact of Delivery Stops on Traffic Speeds
Liu, X., Qian, S., Teo, H.-H., and Ma, W. (2022).
Estimating and mitigating the congestion effect of curbside pick-ups and drop-offs: A causal inference approach. Transportation Science.
Finding: Each additional 100 vehicle stops can reduce nearby traffic speeds by up to 3.7 mph on weekdays and 4.5 mph on weekends.
https://doi.org/10.1287/trsc.2022.0195
[21] – Share of Cargo-Bike Deliveries to Residential Addresses
New York City Department of Transportation. (2021).
Commercial Cargo Bicycle Pilot: Evaluation Report.
Finding: Approximately 80 percent of cargo-bike deliveries in NYC are made to residential addresses.
https://www.nyc.gov/html/dot/downloads/pdf/commercial-cargo-bicycle-pilot-evaluation-report.pdf
[22] – CO₂ Savings per Cargo Bike
New York City Department of Transportation. (2021).
Commercial Cargo Bicycle Pilot: Evaluation Report.
Finding: Replacing twenty daily van miles with twenty cargo-bike miles avoids approximately seven tons of CO₂ per bike per year.
https://www.nyc.gov/html/dot/downloads/pdf/commercial-cargo-bicycle-pilot-evaluation-report.pdf
[23] – CO₂ Equivalency Conversion
Environmental Protection Agency. (2023).
Greenhouse Gas Equivalencies Calculator.
Conversion shows that 1,500 tons of CO₂ avoided annually is roughly equal to several million fewer car miles.
https://www.epa.gov/energy/greenhouse-gas-equivalencies-calculator
[24] – Diesel Truck Share of PM₂.₅ Emissions
FIA Foundation. (2024).
Target the oldest diesel trucks to reduce racial disparities in air pollution exposure in NYC.
Finding: Diesel trucks make up less than 10 percent of vehicles but produce up to 80 percent of PM₂.₅ emissions.
https://www.fiafoundation.org/news/target-the-oldest-diesel-trucks-to-reduce-racial-disparities-in-air-pollution-exposure-in-nyc
[25] – Health Impact of PM₂.₅ Exposure in NYC
New York City Department of Health and Mental Hygiene.
Traffic and Air Pollution: Data Story.
Finding: Long-term PM₂.₅ exposure contributes to ~2,000 premature deaths annually.
https://a816-dohbesp.nyc.gov/IndicatorPublic/data-stories/traffic-and-air-pollution/
[26] – Pollution Burden on Vulnerable Communities
FIA Foundation. (2024).
Same report as [24].
Finding: Neighborhoods near major warehouse clusters and high truck volumes often face disproportionate pollution burdens, especially in low-income and historically marginalized communities.
Bibliography
Amaya, J., Encarnación, T., & Delgado-Lindeman, M. (2023). Understanding delivery drivers’ parking preferences in urban freight operations. Transportation Research Part A: Policy and Practice, 176. https://doi.org/10.1016/j.tra.2023.103775
Baker, L. (2020, February 13). New York City hit UPS with $23 M in parking fines in 2019. FreightWaves. https://www.freightwaves.com/news/ups-hit-with-22m-in-nyc-parking-fines
Belgian Cycle Logistics Federation, & Kale AI. (2023). Electric cargo bikes vs. traditional vans: A cost and efficiency comparison for urban logistics. Brussels, Belgium.
City of New York, Mayor’s Office. (2024, April). LockerNYC launch: Combat package theft & reduce truck congestion. https://www.nyc.gov/mayors-office/news/2024/04/mayor-adams-dot-commissioner-rodriguez-launch-lockernyc-combat-package-theft-reduce
City of New York Department of Health and Mental Hygiene. (n.d.). Traffic and air pollution: Data-story – IndicatorPublic. https://a816-dohbesp.nyc.gov/IndicatorPublic/data-stories/traffic-and-air-pollution/
City of New York Department of Transportation. (2021). Commercial cargo bicycle pilot: A new mode for last-mile deliveries in NYC – Evaluation report. https://www.nyc.gov/html/dot/downloads/pdf/commercial-cargo-bicycle-pilot-evaluation-report.pdf
City of New York Department of Transportation. (2021). Delivering New York: A smart truck management plan. https://www.nyc.gov/html/dot/downloads/pdf/delivering-ny-smart-truck-management-plan.pdf
City of New York Department of Transportation. (2023). Delivering green: A vision for a sustainable freight network serving New York City. https://www.nyc.gov/html/dot/downloads/pdf/freight-vision-plan-delivering-green.pdf
Colonna, L., Marcucci, E., Gatta, V., & Comi, A. (2025). Cargo bikes and van deliveries in Rome: A comparative analysis. Future Transportation, 5(4), 145. https://www.mdpi.com/2673-7590/5/4/145
Con Edison. (2024). Residential and commercial electricity rates. https://www.coned.com/en/accounts-billing/your-bill/rates
Cokyasar, T., Jabali, O., & Van Woensel, T. (2022). A time-constrained capacitated vehicle routing problem in urban e-commerce delivery. Transportation Research
Part E. arXiv preprint: https://arxiv.org/abs/2201.04036
DSP Job Hub. (n.d.). E-Bike Delivery Associate – COPR Industries LLC [Job posting]. https://dspjobhub.com/job/e-bike-delivery-associate-copr-industries-llc-in-brooklyn-ny-united-states-jid-894
Edmunds. (2024). MSRP ranges for Class 2a–3 internal-combustion cargo vans. https://www.edmunds.com/
EIT InnoEnergy. (2024, March 20). Study: Logistics companies could save over half a billion euros annually using mixed electric delivery fleets. https://www.innoenergy.com/news-resources/study-logistics-companies-could-save-over-half-a-billion-euros-annually-using-mixed-electric-delivery-fleets/
Environmental Protection Agency. (2023a). Greenhouse gas emissions from a typical passenger vehicle. https://www.epa.gov/greenvehicles/greenhouse-gas-emissions-typical-passenger-vehicle
Environmental Protection Agency. (2023b). Greenhouse gas equivalencies calculator. https://www.epa.gov/energy/greenhouse-gas-equivalencies-calculator
FIA Foundation. (2024). Target the oldest diesel trucks to reduce racial disparities in air pollution exposure in NYC. https://www.fiafoundation.org/news/target-the-oldest-diesel-trucks-to-reduce-racial-disparities-in-air-pollution-exposure-in-nyc
Harper, J. (2020, February 18). UPS, FedEx rack up parking violations as city
struggles to reduce congestion. Gothamist. https://gothamist.com/news/ups-fedex-rack-parking-violations-city-struggles-reduce-congestion
Inside Climate News. (2025, March 30). The online shopping boom comes at a price — and some New Yorkers pay more than their fair share. https://insideclimatenews.org/
International Council on Clean Transportation. (2022). Total cost of ownership for commercial vans and urban delivery vehicles in the United States. https://www.theicct.org/wp-content/uploads/2022/01/cost-ev-vans-pickups-us-2040-jan22.pdf
Liu, X., Qian, S., Teo, H.-H., & Ma, W. (2022). Estimating and mitigating the congestion effect of curbside pick-ups and drop-offs: A causal inference approach.
Transportation Science. https://doi.org/10.1287/trsc.2022.0195
Logistics Xpress Inc. (2025). Delivery Driver – Amazon Delivery Partner (Non-CDL) [Job posting]. ZipRecruiter. https://www.ziprecruiter.com/
New York City Independent Budget Office. (n.d.). Stipulated Fine Program: Summary statistics. https://ibo.nyc.ny.us/Revenue/spf-cover.html
RefineRisk. (2024). Commercial auto insurance costs for NYC delivery fleets. https://www.refinerisk.com/commercial-auto-insurance-cost-nyc-delivery/
Supply Chain Digital. (2021). UPS to convert UPS diesel delivery trucks in NYC to electric. https://supplychaindigital.com/technology/ups-convert-ups-diesel-delivery-trucks-nyc-electric
U.S. Department of Energy, Alternative Fuels Data Center. (2024). New medium-duty electric vehicle pricing (Class 2–3 vans and trucks). https://afdc.energy.gov/vehicles/search
U.S. Department of Energy, Office of Energy Efficiency & Renewable Energy. (2024). Fuel economy for delivery vans and light trucks. https://www.fueleconomy.gov/feg/commercial/index.shtml
University of Washington Urban Freight Lab. (2023). Biking the goods: Evaluating electric cargo bike delivery performance and efficiency in urban environments. Seattle, WA.
Washington State Department of Commerce. (2023). Public fleet electrification analysis: Total cost of ownership findings. https://www.commerce.wa.gov/wp-content/uploads/2023/01/EV-Fleet-Electrification-Analysis.pdf
Yang, H., Landes, H., & Chow, J. Y. J. (2023). 2021 New York City daily residential parcel volume and stops [Dataset]. Zenodo. https://doi.org/10.5281/zenodo.7927126
Zhang, X., Chow, J. Y. J., & Banerjee, A. (2023). A large-scale analytical residential parcel delivery model evaluating greenhouse gas emissions, COVID-19 impact, and cargo bikes. International Journal of Transportation Science and Technology. https://www.sciencedirect.com/science/article/pii/S2046043023000692